Updated 3/31/21
With Google Analytics, you can easily spend countless hours analyzing reports about your website you didn’t even think were possible to generate! But when you are managing a business, time is everything.
So, how can you maximize your Google Analytics efforts for an eCommerce site?
Below are 5 important metrics that will help you analyze your online store’s performance. If you are new to Google Analytics, be sure to enable eCommerce tracking in your settings. Without enabling this feature, you will not be able to track sales and your online conversion rate with Analytics. To enable, follow these simple steps:
- Login to your Google Analytics account
- Select Admin in the top right
- Select View Settings under the column View (Profile)
- Under eCommerce Settings, click the drop-down box and select ‘Yes, an Ecommerce Site’
If you are using Magento to manage your store, you will need provide Magento your Google Analytics Account Number. In your Admin panel go to System -> Configuration -> Google API (under Sales) and enable Google Analytics and provide your Account Number. For Magento users, you are done!

For those not on Magento, please consult the operating system you use to manage your store. To learn more about the eCommerce tracking codes for Google Analytics, check out this article from Analytics Help.
1. Goals
If you defined goals for your website then you can add them into Google Analytics and track their progress. As your site changes over time and new features are added, you can monitor the success of these changes with defined goals. For instance, if you publish a downloadable white paper to your site and set a goal of 25 downloads a month, then you can have Google Analytics capture the number of downloads. There are 4 types of goals in Google Analytics: URL Destination: tracks a goal when someone lands a specific URL, such as the /success page after a purchase has been made. (use this goal to measure your shopping cart abandonment rate)

Visit Duration: if you are working on increasing the time a visitor spends on a specific page, set up a visit duration goal for that page and define the amount of time you would like a visitor to stay on that page. Pages/Visit: set a number of pageviews you would like users to achieve while visiting your site. Event*: record a specific event that occurred on your site. You can have fun with this type of goal and track: downloads, number of times a video was played, a contact us form was submitted, and much more. Visit Google’s Event Tracking page to learn more. If you have multiple store locations, you can setup an event goal to track contact forms per location! If your contact form doesn't direct users to a confirmation page with a unique URL, you can use this handy tool from Raven that helps you generate the needed code for your site. *Event tracking will require additional code being added to your existing Google Analytics code on your site. Here are the steps to creating a goal:
- Select Admin in the top right
- Select Goals under the column View (Profile)
- Select Create A Goal
2. Bounce Rate & Avg. Visit Duration
These two metrics are crucial to understanding a visitor’s first impression of your webpage. If you have an extremely high bounce rate, say 70%, then 70% of your online visitors are leaving your site without clicking through to another page. Not only are you losing potential customers, but a high bounce rate can have a negative effect on your SEO. Think about it. Google doesn’t want to display websites that aren’t satisfying a searcher’s needs. Average visit duration is useful to view the amount of time users are on your site.

For an eCommerce site, your aim needs to be lowering your bounce rate as much as possible. There are a number of factors that can account for having a high bounce rate. Two of the major factors are: site design and message. Presentation is everything when it comes to marketing your product and brand. Make sure your website has a design that complements your brand. Be sure to look at the message visitors are being presented when they arrive at your website. A good approach to refining your message is to develop a content strategy. This will help you in preparing a consistent message for visitors. When developing content for a page on your website, consider where you anticipate visitors to be in the sales cycle when reading the content on that page.
3. eCommerce Conversion Rate
Knowing the conversion rate for your online store tells you how successful your website is converting visitors into customers. To calculate this percentage, use this equation:
Number of Transactions / Site Visits * 100
If you are not converting visitors on your site into customers, start reviewing:
- Sales message
- Pages with highest bounce rates & %Exits
- Optimizing your checkout process (implement a one-page checkout)
You can view your eCommerce Conversion Rate in the eCommerce Overview report as seen below:
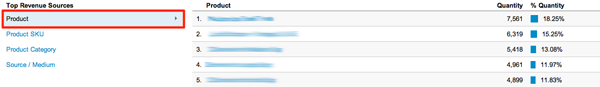
4. Revenue Sources (Product, Category, Source)
If your site is converting visitors into customers and you are interested in viewing more information about the source of your online revenue, Google Analytics will show you: Product Revenue: view the quantity of products sold for product A and percentage quantity of product A compared to total product sells. If you select an individual product then you can view more detailed information such as: unique purchases, revenue, average price, and more).
SKU: same options as product revenue except you view sales performance by SKU Product Category: same options as product revenue except you view sales performance by category. Very useful if you are trying to determine your best selling categories or trying to track performance for a category created specifically for a holiday. Source / Medium: Here is where you can have some fun playing with the data. This report lets you see revenue generated from your marketing efforts. If you are doing SEO, PPC, Email Marketing, etc. then you can monitor the success of these campaigns here.

5. Multi-Channel Funnels
Now that you know how to break down sales by source, Google Analytics gives you the ability to go one step further...see the cycle it took to acquire a sale! In the Multi-Channel Funnels report, Google will show you the process a customer underwent to make a purchase, i.e. if they visited your site and left, clicked on your PPC ad three days later and finally made a purchase. Here are the reports you can run: Assisted Conversions: view the number of times a channel (PPC, Organic Search, Email, etc.) appeared on the conversion path but was not the final channel to convert the visitor. Top Conversion Paths: view your marketing paths that are converting the most. This report also shows marketing channels working together to form paths, such as Organic -> Paid Search. In this example, the user originally visited the site via an organic search but later purchased an item after clicking on a paid ad.

Time Lag: view the number of days till conversion since the visitor’s initial visit to the website. Path Length: view the number of conversions resulted from a particular number of conversion paths. There are plenty of additional reports in Google Analytics that are important and useful to monitor. The 5 listed above are important metrics that business owners should monitor very closely since they provide an accurate view of their sites performance and online revenue. Let us know your thoughts on helpful reports that you monitor frequently to gauge your online success!
Check out more great eCommerce products, services, and resources from IWD
eCommerce Development
- Shopify Web Development Company
- Shop Online Pickup In Store
- eCommerce Consulting Agency
- Custom eCommerce Development
- Magento Web Development Company
- eCommerce Email Marketing Agency
Products & Extensions
- B2B eCommerce Solutions
- Best Magento 2 Extensions
- Magento 2 One Page Checkout
- Recurring Subscription Billing
- POS eCommerce
- Address Validation Service
checkout other great extension